Starhill Global REIT at a 52-Week Low: Does a 7.75% Yield Signal Value?
Units sit at a 52-week low on a 7.75% trailing yield with five years of flat DPU. We test the payout cover, gearing and Orchard Road risk.
The last session was quiet for Starhill Global REIT (SGX: P40U) in one sense: the units closed at S$0.485, exactly where they finished the day before. In every other sense it was telling. That price is the lowest the trust has traded in 52 weeks, 19.17% below the S$0.60 high and 17.80% lower year to date. Only 887,500 units changed hands, roughly a quarter of the 20-day average of 3.5 million, and the 14-day relative strength index sat at 41.7.
There was no fresh company announcement behind the level. The pressure looks macro. The Straits Times Index fell 6.01% over the past month, as banks dragged it into a technical correction while long bond yields rose and earnings expectations were questioned. The 10-year US Treasury yield was about 4.93% at the end of October, down from 5.29% at end-September but still high enough to compete with dividend payers. HSBC also cut Singapore stocks to neutral, citing stretched valuations and financial conditions weighing on the real estate sector. For a small-cap REIT paying out twice a year, that is the kind of backdrop that pushes a price to the bottom of its range without a single piece of bad news.
What the trust owns and how it earns
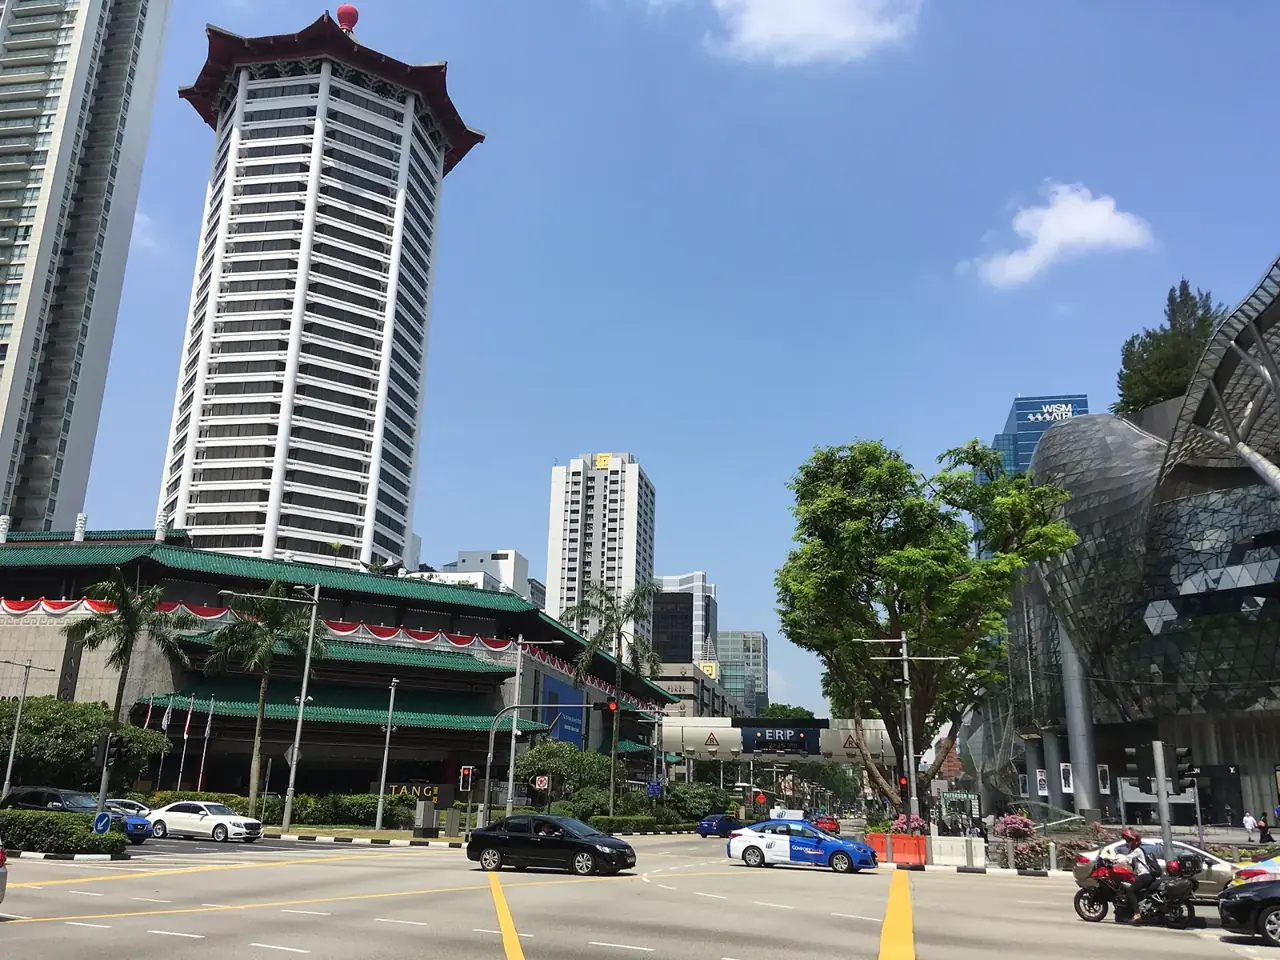
Starhill Global REIT owns about S$2.7 billion of retail and office property across Singapore, Malaysia, Australia and China. The portfolio is anchored by two Orchard Road landmarks, Ngee Ann City and Wisma Atria, with the Toshin master lease at Ngee Ann City alone accounting for 23.8% of gross revenue. Singapore is roughly 70% of revenue, Malaysia (The Starhill and Lot 10 in Kuala Lumpur) around 16%, and Australia (Adelaide and Perth) about 12%.
The money comes from rent, and a large slice of it is contractual rather than negotiated annually. Master leases contribute around 53% of gross revenue and the weighted average lease expiry is 7.1 years, which gives unusually long visibility for an S-REIT. The trade-off is built in: long leases with fixed step-ups protect income in a downturn but cap the upside when Orchard Road rents run hot. YTL Corporation and related interests hold about 38% of the trust, and the manager is YTL Starhill Global REIT Management.
A steady year, not a growing one
For FY2025/26, the year ended 30 June 2026, distribution per unit rose 0.8% to 3.68 cents. The second half did the work, with DPU up 1.6% to 1.88 cents, net property income up 1.0% to S$75.3 million and distributable income up 3.6% to S$46.1 million. Full-year net property income was up just 0.1% and distributable income 1.7%. Committed occupancy improved to 97.2% from 94.6%, helped by a replacement anchor tenant at the Chengdu property from March 2026. Gearing was 35.8%, interest cover 3.1x and the average interest rate 3.66%, with 80% of debt fixed or hedged and a BBB rating affirmed in September 2026.
The first quarter of FY2026/27, reported on 29 October, looked similar: gross revenue up 1.2% to S$48.9 million and net property income up 2.3% to S$38.8 million, with occupancy at 97.4%. Gearing was 36.0% and interest cover 3.2x. The manager also refinanced an A$63 million Australian term loan and, in October, redeemed a S$70 million Singapore bond using a new six-year facility, leaving S$350 million of undrawn committed credit lines.
On 9 October the trust sold Ebisu Fort in Tokyo for about S$50.2 million at a 53.8% premium to its last valuation, exiting Japan and taking pro forma gearing to 34.5%. The asset was only earning a 2.4% yield, so recycling it is sensible housekeeping, though the proceeds now need a home.
Is the distribution covered?
The payout has been remarkably stable, and remarkably flat:
| Financial year | 1H DPU (cents) | 2H DPU (cents) | Full year (cents) |
|---|---|---|---|
| FY2021/22 | 1.78 | 2.02 | 3.80 |
| FY2022/23 | 1.82 | 1.98 | 3.80 |
| FY2023/24 | 1.78 | 1.85 | 3.63 |
| FY2024/25 | 1.80 | 1.85 | 3.65 |
| FY2025/26 | 1.80 | 1.88 | 3.68 |
Source: trust distribution history; full-year totals are the sum of the two half-year payouts.
That table is the heart of the story. Income has been resilient through a pandemic, a rates shock and asset sales, and there has been no distribution cut. But a holder today collects slightly less per unit than in FY2021/22. The trust pays part of its management fee in units and ran a distribution reinvestment plan for the latest payout at an issue price of S$0.5385, so the unit count creeps up and per-unit growth lags growth in total distributable income. That is not a warning sign by itself, but it explains why 3.6% income growth became 1.6% DPU growth.
Balance sheet quality is decent rather than fortress-like. Gearing of 36.0% sits well under the 50% regulatory cap, and 3.3 years of weighted average debt maturity means little near-term refinancing risk. Interest cover of 3.2x is the number to watch: the trust’s own sensitivity shows cover falling to 2.5x if the average interest rate rises by one percentage point. The S$100 million of perpetual securities at 3.25% counts as equity in the gearing calculation, which flatters that ratio slightly, though the interest cover figure does deduct the perpetual distributions.
Valuation
At S$0.485 the trailing yield of 7.75% is one of the higher figures in the S-REIT sector. On the FY2025/26 DPU of 3.68 cents, the arithmetic gives about 7.6%, so the two measures agree closely. Price to book is 0.67, against an implied net asset value of about S$0.72 per unit, meaning the market is valuing the portfolio at roughly a third below the valuer’s number.
Note how the yield got here. The manager itself calculated a 7.2% yield on a 51 cent price at 30 June 2025, and 6.0% on an annualised basis at 59.5 cents at the end of December 2025. The payout grew by fractions of a cent over that stretch. Almost all of the yield expansion has come from the unit price falling, not from the distribution rising, which is the difference between a re-rating and a pay rise.
A trailing P/E of 23.75 needs context. For a REIT, accounting profit is distorted by fair value changes, divestment gains and losses, and depreciation, so the P/E is a weak guide. Yield against the payout and price to book are the better lenses here. We could not verify current yields for direct peers for this piece, so the comparison below is with Starhill’s own history rather than the sector.
The bull case
The income is unusually contracted. Seven-year WALE, master leases covering half of gross revenue and full occupancy at the Singapore retail assets mean next year’s rent is largely already agreed. Occupancy has improved, not deteriorated. Gearing is 14 points below the cap, the debt is unsecured with a BBB rating, and the manager has not asked unitholders for fresh equity in a decade. The Ebisu sale shows a willingness to recycle at premiums to book. At 0.67 times book, much of the rate pain is arguably already in the price, and a 7.6% yield against a 4.93% US 10-year yield is a spread of about 2.7 percentage points.
The bear case
Flat DPU for five years is the central objection. A 7.6% yield that never grows is a bond with equity risk attached, and bonds now pay more than they did. Interest cover of 3.2x is thinner than at larger peers, and the one-point sensitivity to 2.5x shows how little room there is if funding costs turn. Wisma Atria is the operational soft spot: in the September quarter, shopper traffic rose 9.1% year on year while tenant sales fell 21.9%, which the manager attributes to tenant transition downtime and a change in mix. New facade tenants have opened, but weak tenant sales eventually feed into rental reversions. The Adelaide office component was only 29.6% occupied as at 30 June 2025, a reminder that not every asset is Orchard Road. Add concentration in one master tenant, FX translation swings across four currencies, and the dilution from scrip-based fees.
The bottom line
This is not a distribution in distress. Cover exists, gearing is moderate, leases are long and the payout has never been cut. But a 7.75% yield on a flat DPU is a fair price for a low-growth, rate-sensitive asset, not an obvious bargain. Three things would shift that judgement: interest cover holding at or above 3x through the next refinancing round, positive rental reversions at Wisma Atria once the facade works are complete, and the Ebisu proceeds going into assets that add to DPU rather than dilute it. Until those show up in the numbers, the high yield reads as compensation for slow growth and rate sensitivity rather than a mispricing, and investors weighing it against Singapore bonds should ask whether the extra 2.7 points of spread is enough for the equity risk.