Starhill Global REIT: Is a 7.5% Yield Value or a Warning Sign?
Units sit near a 52-week low on a 7.5% trailing yield. We test Starhill's payout cover, 36% gearing and 3.1x interest cover.

Starhill Global REIT (SGX: P40U) added 0.5 cents to close at S$0.505 last session, a 1.0% gain on volume of about 2.98 million units, roughly 1.2 times its 20-day average of 2.47 million. That bounce needs context. The units sit 15.8% below the 52-week high of S$0.60, are down 14.4% year to date, and ended the session just 2.0% above the 52-week low of S$0.495. They trade below both the 50-day average of S$0.5113 and the 200-day average of S$0.5417.
The broader market was no help. The Straits Times Index fell 0.65% to 5,269.29 on the same day and is down 6.97% over the past month, with a 14-day RSI of 20.6, a reading usually associated with heavy selling. I found no company-specific announcement behind the last session’s 0.5 cent gain, so treat it as a modest rebound in a weak tape rather than a change in story.
What the trust owns and how it earns
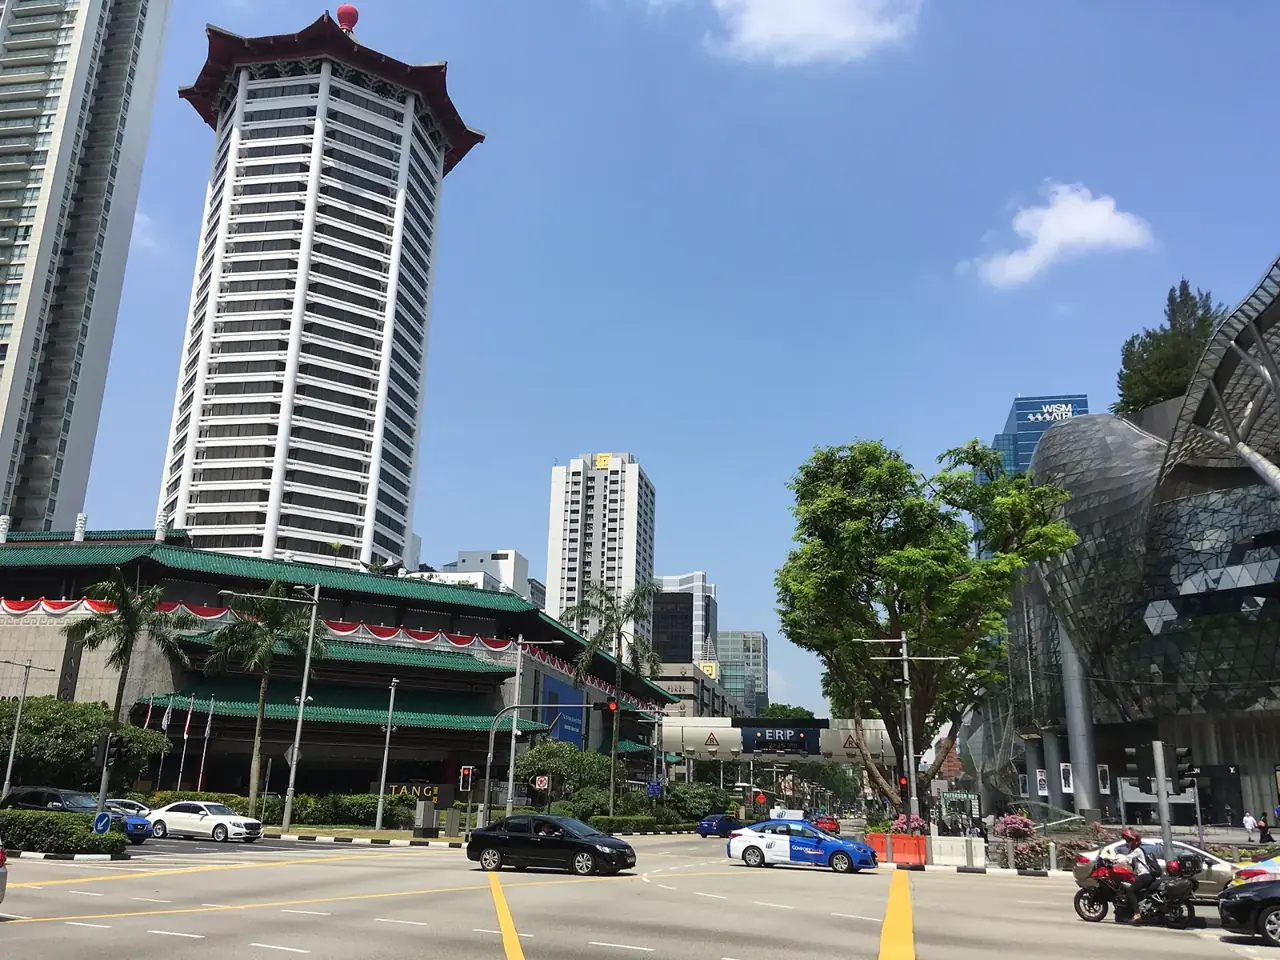
Starhill owns retail and office property, mostly in Asia Pacific, with a portfolio valued at about S$2.7 billion. The biggest assets are on Orchard Road: Ngee Ann City, where the Toshin master lease is the single largest income source, and Wisma Atria. Overseas, it holds Myer Centre Adelaide, the David Jones Building and Plaza Arcade in Australia, The Starhill and Lot 10 in Kuala Lumpur, and a property in Chengdu.
Income comes overwhelmingly from rent, and much of it is locked into long master leases rather than short shop-by-shop tenancies. In the first quarter of FY2026/27, Singapore supplied 60.6% of revenue, Australia 22.1% and Malaysia 15.8%. The trust is managed by YTL Starhill Global REIT Management, part of the YTL group.
The latest numbers
Full-year FY25/26 results, for the 12 months to 30 June 2026, were stable rather than exciting. Gross revenue came in at S$192.5 million, up 0.2%, and net property income at S$150.3 million, up 0.1%. Income available for distribution rose 1.7% to S$89.3 million, and DPU grew 0.8% to 3.68 cents.
The first quarter of the new year, reported on 29 October 2026, was slightly better. Gross revenue rose 1.2% to S$48.9 million and net property income 2.3% to S$38.8 million. Excluding the effect of divestments, net property income would have grown 3.3%. Committed occupancy improved to 97.4% from 97.2% at the June year end, and weighted average lease expiry by gross rental income stood at 7.1 years.
Two details inside that quarter are worth flagging. Wisma Atria’s net property income fell 4.9% on tenant changeovers, and tenant sales there dropped 21.9% year on year even as shopper traffic rose 9.1%, which the manager attributes to a shift in trade mix. Separately, roughly two thirds of the S$0.9 million increase in net property income came from the two smallest assets, where a lower rental arrears provision on the Chengdu property lifted that segment from S$0.2 million to S$0.8 million. Strip that out and the quarter is flatter than the headline.
Can the 7.5% payout hold?
The trailing yield in the data is 7.52%. Using the FY25/26 DPU of 3.68 cents against the S$0.505 close gives about 7.3%, so the two measures agree within methodology differences.
Cover looks adequate. The trust distributed S$85.3 million of the S$89.3 million available for distribution, retaining S$4.0 million for working capital. That is a payout of roughly 96% of distributable income, leaving a small but real buffer.
The balance sheet is reasonable for a mid-sized REIT. At 30 June 2026, total debt was S$1,015 million, gearing 35.8% against the 36.0% a year earlier, and well under the 50% regulatory ceiling. Interest cover was 3.1 times, up from 2.9 times, and the average interest rate was 3.66%. About 80% of debt is fixed or hedged, weighted average debt maturity is 3.3 years, and the corporate rating is BBB/Stable, affirmed in September 2026.
There are two caveats. First, 3.1 times interest cover is calculated after including distributions on the S$100 million of 3.25% perpetual securities, which are a claim ahead of ordinary unitholders; that coupon alone runs to roughly S$3.3 million a year. Second, cover improved partly because funding costs fell, not because earnings grew strongly.
On 9 October 2026 the trust completed the sale of Ebisu Fort in Tokyo for about S$50.2 million, a 53.8% premium to its last valuation, which also marks its exit from Japan. The manager expects gearing to fall from 35.8% to about 34.5% if proceeds go to repaying borrowings. That is genuine balance sheet room.
Value or value trap?
The price-to-book ratio of 0.72 is the most eye-catching number. It implies units change hands at roughly 28% below book value, or about 70 cents of book value per unit at the current price. The P/E of 25.5 is less useful for a REIT, since reported earnings include property fair value movements that say nothing about cash flow.
Here is a like-for-like comparison with a larger retail peer, though note the two report on different year ends:
| Metric | Starhill (P40U) | Frasers Centrepoint Trust (J69U) |
|---|---|---|
| Trailing distribution yield | 7.5% | About 6.0% |
| Aggregate leverage | 35.8% (30 Jun 2026) | 38.7% (30 Sep 2026) |
| Interest coverage | 3.1x | 4.37x |
| Committed occupancy | 97.2% (30 Jun 2026) | 99.7% (30 Sep 2026) |
| Latest financial year DPU growth | +0.8% | +2.0% |
The FCT yield is my arithmetic on its FY2026 DPU of 12.35 cents and its S$2.06 close on 21 October 2026. Starhill offers roughly 150 basis points more yield, but with noticeably weaker interest cover and slower distribution growth. In a sector where investors can choose, that gap is the market’s price for the extra risk.
The bull case
The discount to book is wide, and the assets are not distressed: Orchard Road landmarks, 97.4% committed occupancy and a lease book averaging more than seven years by gross rental income. Master leases with tenants such as Toshin and the Malaysian master tenancies give income visibility that pure multi-tenant retail does not.
The Ebisu sale shows management will recycle capital at good prices, and the lower gearing that follows creates debt headroom for acquisitions or asset enhancement works, both of which the manager says it is assessing. If Singapore interest rates stay contained, the 80% hedged book limits refinancing shocks, and a REIT yielding above 7% with a BBB rating will appeal to income-focused investors.
The bear case
The distribution record is the core problem. Half-yearly DPU has hovered between 1.78 and 1.88 cents for several years, and full-year DPU has gone from 3.80 cents in FY2021/22 to 3.68 cents in FY25/26. That is not growth, it is drift, and a 7.5% yield that never rises quietly becomes a 7.5% total return minus inflation.
Operationally, Wisma Atria’s 21.9% fall in tenant sales is a live question, and the manager itself cites weak consumer confidence, cost pressure and online competition in Singapore retail. Australia and China have been inconsistent contributors, and currency movements cut both ways. Interest cover of 3.1 times is thin by large-REIT standards, leaving less room if funding costs rise or income dips. The unit price trend reflects all of this: below both key moving averages, with the 52-week low only 2% away.
The bottom line
Starhill is not a distribution being paid out of reserves or borrowings. Payout is covered by income, gearing is modest, three quarters of the debt is hedged and the rating is investment grade. The 7.5% yield is being funded by real rent, largely from long leases on prime Orchard Road property.
What the yield is not is a growth yield. DPU has moved sideways for years, interest cover is thinner than peers, and the discount to book has persisted precisely because investors doubt that the distribution will ever rise meaningfully. A 0.72 price-to-book ratio is either a cheap entry point or a fair price for a low-growth asset, and which one it is depends on things unitholders can watch: whether Wisma Atria’s tenant sales stabilise after the trade mix change, whether interest cover keeps improving from 3.1 times, and what the manager does with the gearing capacity from the Ebisu sale. Until those three line up, the yield is compensation for waiting, not a signal that the wait is over.